Cold Calling Conversion Rate: Benchmarks and Formula
Cold Calling Conversion Rate benchmarks range from 0.3% to 2.3%. Learn the formula, funnel stages and fixes to lift yours.
One team reports a cold calling conversion rate that's ten times higher than another team's, and neither team is necessarily lying. They're often counting different things. One divides meetings by every dial, including no answers and wrong numbers. The other divides meetings by conversations with people who picked up and talked.
That denominator choice changes everything downstream. It changes your forecast, your hiring plan, and your diagnosis when results slip. If you quote the wrong rate, you'll fix the wrong problem, usually by adding dial volume when the leak sits in contact data, timing, or qualification. Read every benchmark by stage first, and the numbers start to agree.
Cold Calling Conversion Rate Benchmarks and Why They Differ
The same activity shows up as 0.3% in one study and 2.3% in another. Both can be correct because they don't measure the same outcome from the same starting point.
The Baylor University Keller Center for Research study summarized by CloudTalk examined 6,264 cold calls made by 50 real estate agents over two weeks and found a cold call to appointment rate of approximately 0.3%, equal to about one appointment for every 330 dials on an unsegmented, random list. That study matters because it counts the full funnel. Every dial enters the denominator, not only the calls someone answered.
A separate historical estimate cited in the same summary put the result at one appointment for every 50 phone calls, or roughly 2%, based on eight calls per hour and one appointment per 6.25 calling hours. That's a more favorable operating assumption, not proof that one study beat the other.
Recent Benchmarks Count a Different Win
The 2025 benchmark attributed to Cognism reported an average cold calling success rate of 2.3%, defined as calls that converted into warm leads or successful outcomes, down from 4.82% in 2024. It also reported approximately 6% in the United States, 6% in European markets, and 8% in the United Kingdom.
A warm lead isn't a booked, qualified meeting. A successful outcome can be softer still. So you can't place 2.3% beside 0.3% and conclude that calling got seven times better. The numerator changed, the list changed, and the markets changed.
| Measurement point | Reported rate | Source | How to read it |
|---|---|---|---|
| Dial to booked meeting, random unsegmented list | about 0.3% (about 1 meeting per 330 dials) | Baylor University Keller Center study | Floor for untargeted prospecting |
| Dial to appointment, historical estimate | about 2% (1 appointment per 50 calls) | Academic sales research | Assumes 8 calls per hour and 1 appointment per 6.25 calling hours |
| Warm lead or successful outcome, 2025 | 2.3% (4.82% in 2024) | Cognism 2025 benchmark | Measures outcomes, not meetings |
| United States, 2025 | about 6% | Cognism 2025 benchmark | Regional outcome rate |
| Europe, 2025 | about 6% | Cognism 2025 benchmark | Regional outcome rate |
| United Kingdom, 2025 | about 8% | Cognism 2025 benchmark | Regional outcome rate |
Six Variables Move Every Headline Figure
Check these before you borrow any number as a goal.
- Denominator: Dials, connects, conversations, and closed deals produce radically different rates from identical work.
- List quality: A random list and a segmented list of accounts with a current need aren't the same input.
- Market and region: Buyer availability, gatekeeper norms, and direct dial coverage vary by country and sector.
- Offer and price point: A cheap, simple next step books more easily than a large commitment discussed with several stakeholders.
- Caller skill and volume: Preparation, opener quality, and objection handling separate reps working similar lists.
- Success definition: Warm interest, a booked call, a held meeting, and qualified pipeline are four different numerators.
Practical rule: Treat the 0.3% result as a floor for broad, poorly segmented prospecting, not as an expected outcome for verified, signal based B2B opportunities.
For a B2B firm selling larger deals, split the headline into three questions. How often do you reach a live person? How often does a conversation become a qualified meeting? How many booked meetings do you get per dial? Judge verified direct lines and signal based targeting by whether they lift each stage, not by whether they beat a blended percentage someone else published.
Before your next forecast, write the denominator and success definition beside every benchmark you use. If either field is blank, treat the figure as a reference point only. It isn't a target yet.
What Each Stage of a Cold Call Funnel Measures
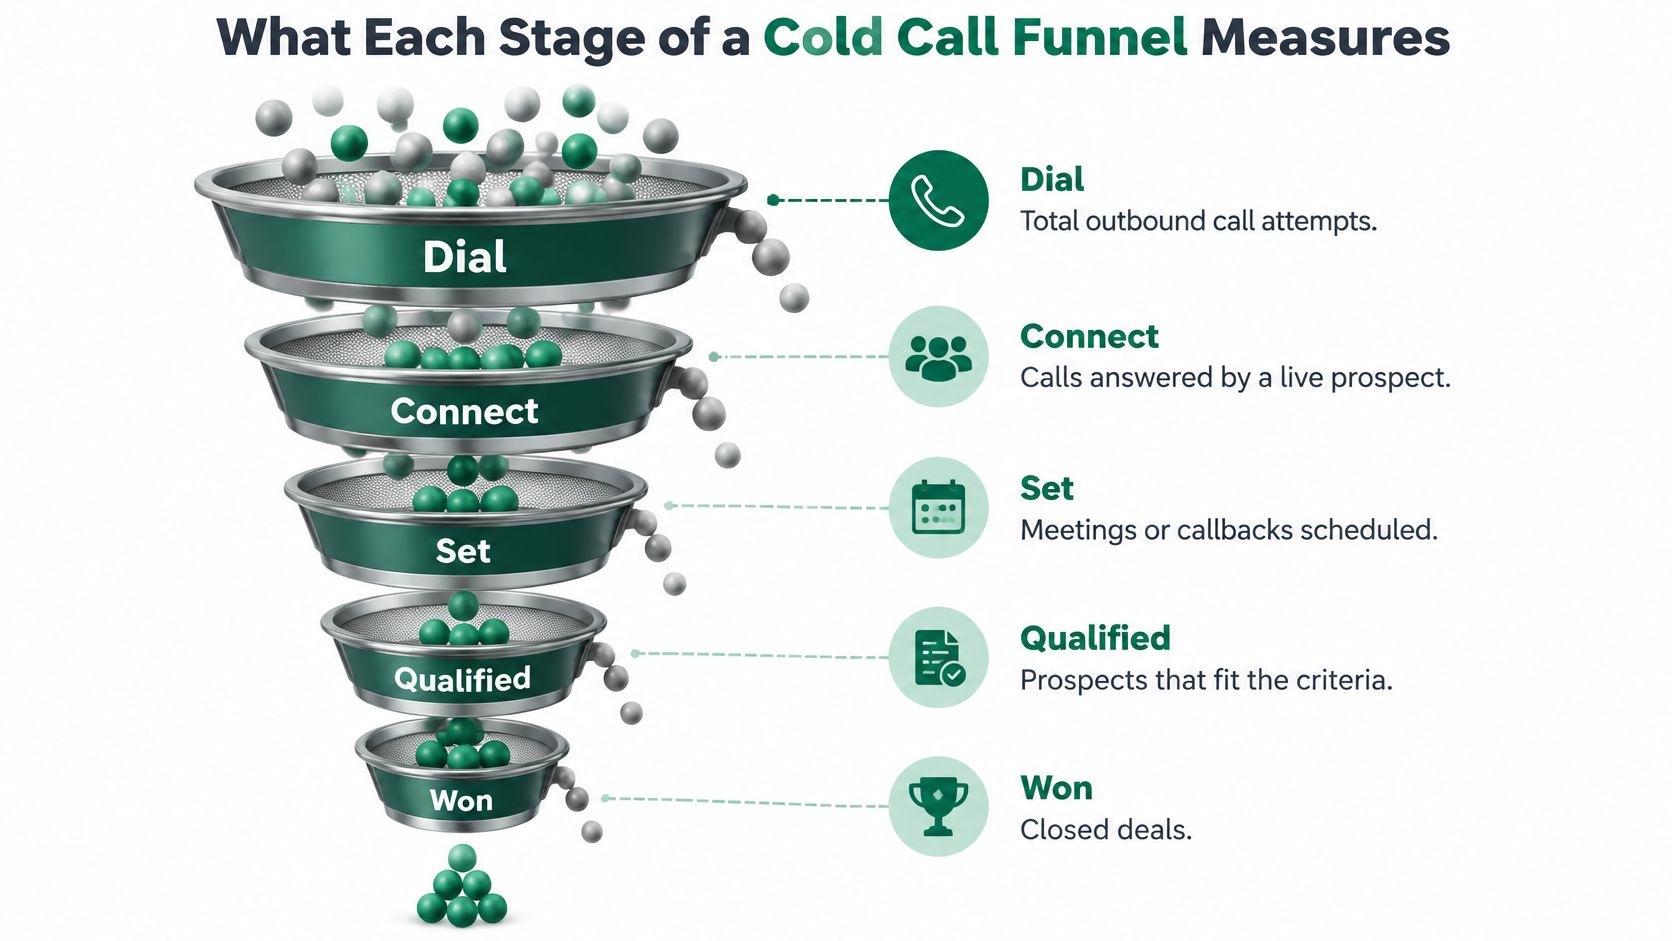
Think of the funnel as a sieve with five mesh sizes. Each layer lets fewer prospects through, and each layer leaks for a different reason. A fine final mesh won't help if the first layer is torn, and a strong top layer can't rescue weak qualification below it.
The diagram below shows the five layers in order, from total attempts down to closed deals.
| Stage | What it counts | Formula |
|---|---|---|
| Dial to connect | Calls answered by a live person | Connects divided by dials |
| Connect to conversation | Connects that become a real two way exchange | Conversations divided by connects |
| Conversation to meeting | Conversations that book a meeting | Meetings divided by conversations |
| Dial to meeting | Every dial that ends in a booked meeting | Meetings divided by dials |
| Meeting to opportunity | Meetings that qualify as pipeline | Opportunities divided by meetings |
Two Definitions Teams Get Wrong
Most benchmarks mean dial to meeting when they say cold calling conversion rate. Many internal reports quote conversation to meeting instead, which always looks better because unanswered calls have already left the denominator. Put both on the dashboard, label them clearly, and never compare one team's dial based rate with another team's conversation based rate.
A connect means a live human answered and you reached the intended prospect or had a real exchange. Voicemail doesn't count. A gatekeeper who ends the call before you reach the prospect doesn't count either, even if your dialer logs it as answered.
A booked meeting also needs a quality test. It counts as a meaningful conversion only if it's held or meets your qualification criteria. Otherwise reps can raise the rate by booking weak calls that never become pipeline, a pattern that's common when teams outsource B2B appointment setting without shared stage definitions.
Write down what counts as success at every stage before your next reporting cycle. One shared definition page prevents months of arguments about whose numbers are real.
How to Calculate Your Cold Calling Conversion Rate
Report every stage, not one blended number. A single percentage tells you that something is wrong, but it won't tell you where.
The process below turns raw call logs into stage rates you can compare week to week.
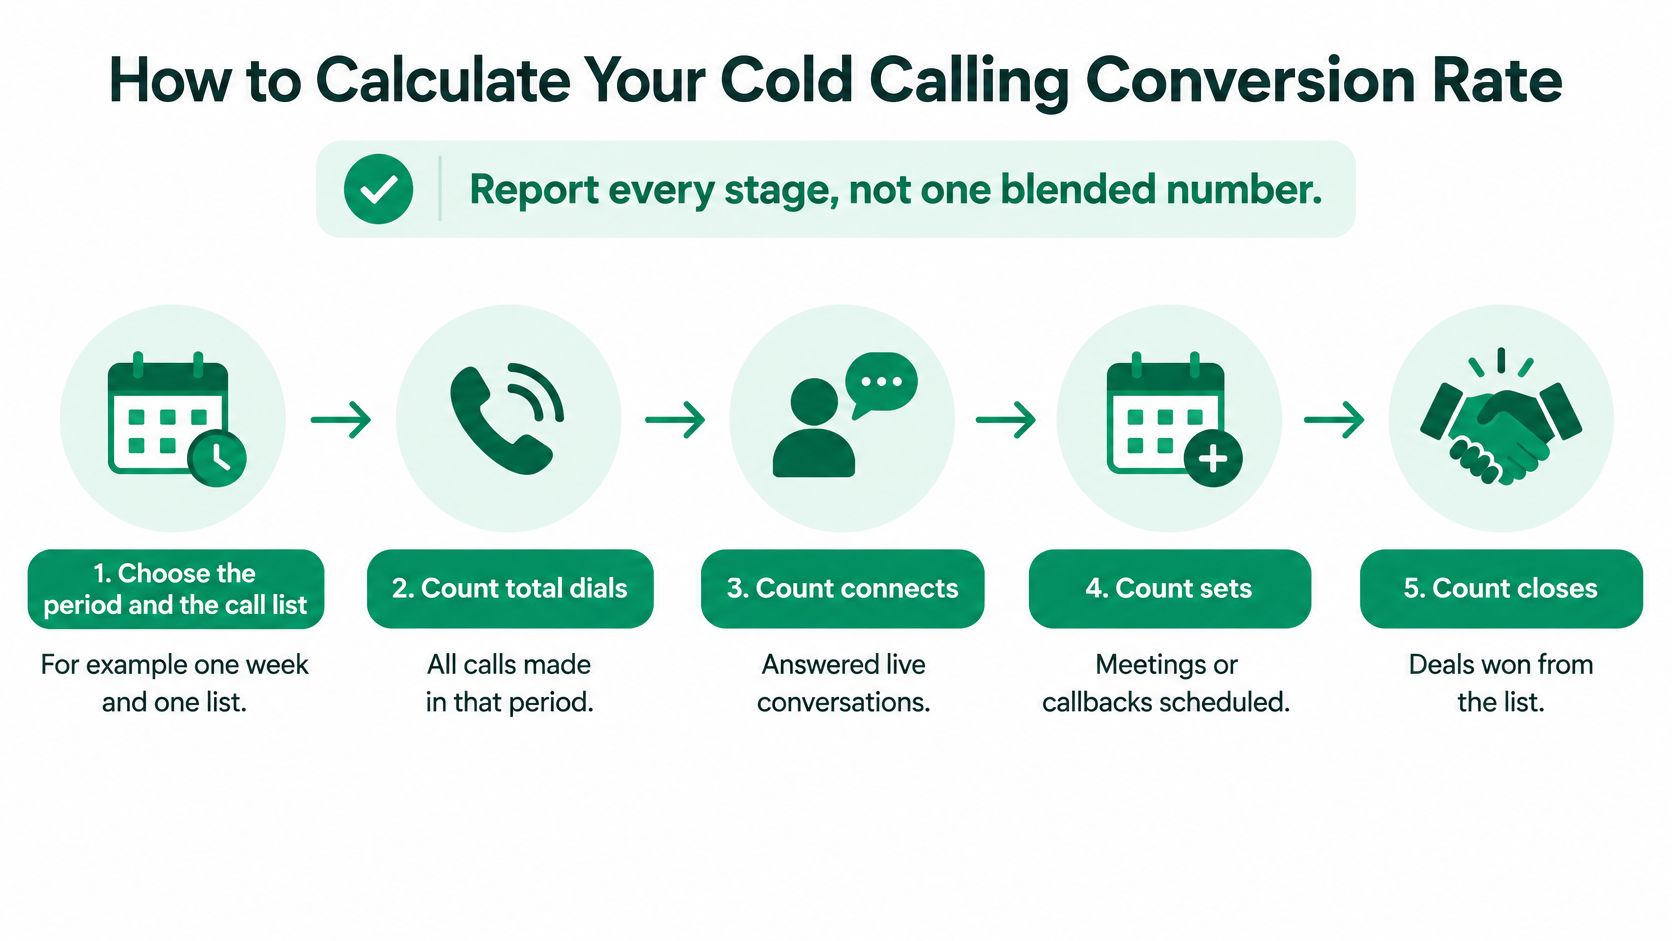
Count in the Same Order Every Time
- Choose the period and the call list. Use one week and one list to start, so you don't mix campaigns with different data quality.
- Count total dials from the call log. Exclude wrong numbers you removed before dialing, since they were never attempts.
- Count live connects. A human answered and you reached a person who could engage, not a voicemail box or an automated menu.
- Count real conversations. The prospect spoke with you about their situation, even briefly. A two second hangup isn't a conversation.
- Count booked meetings the prospect confirmed. Log the date and attendee at booking, so held and qualified status can be checked later.
- Divide each count by the stage before it. Then divide meetings by dials for the end to end rate.
This short walkthrough shows the counting logic in practice before you build your own sheet.
A Large B2B Dataset Shows the Denominator Trap
In Belkins' analysis of more than 175,000 B2B dials summarized in the Enzo Dialer benchmarks, approximately 9.9% of dials connected with a prospect, while 4.6% of conversations resulted in a booked meeting. The resulting end to end rate was about one meeting per 370 dials, or roughly 0.27% of all dials.
That gap is the whole lesson. A team reporting 4.6% may sound strong until you learn it's measuring conversation to meeting. Its dial to meeting result can still sit near the random list floor if few calls connect.
Run the rounded arithmetic yourself. 1,000 dials at a 10% connect rate produce 100 conversations. At a 4.6% conversation to meeting rate, that yields about five meetings. Doubling dials gets you roughly ten meetings at twice the calling cost. Improving connect quality or conversation quality can get you there without doubling effort.
| Stage | Reported rate | Source | How to use it |
|---|---|---|---|
| Dial to connect | about 9.9% | Belkins analysis of more than 175,000 B2B dials | Compare your connect rate against this |
| Conversation to meeting | about 4.6% | Belkins analysis of more than 175,000 B2B dials | Quote only with the denominator stated |
| Dial to meeting | about 0.27% (about 1 meeting per 370 dials) | Belkins analysis, end to end | Check the end to end result |
| Set rate, average representative | 4.6% | Gong analysis of more than 300 million calls | Measured after the prospect answers |
| Set rate, top quartile representative | 16.7% | Gong analysis of more than 300 million calls | Target for the skill and preparation gap |
Build a simple sheet with five columns today: dials, connects, conversations, meetings, and opportunities. Add the stage formulas once, lock them, and review raw counts beside percentages every week.
Five Levers That Move Each Funnel Stage
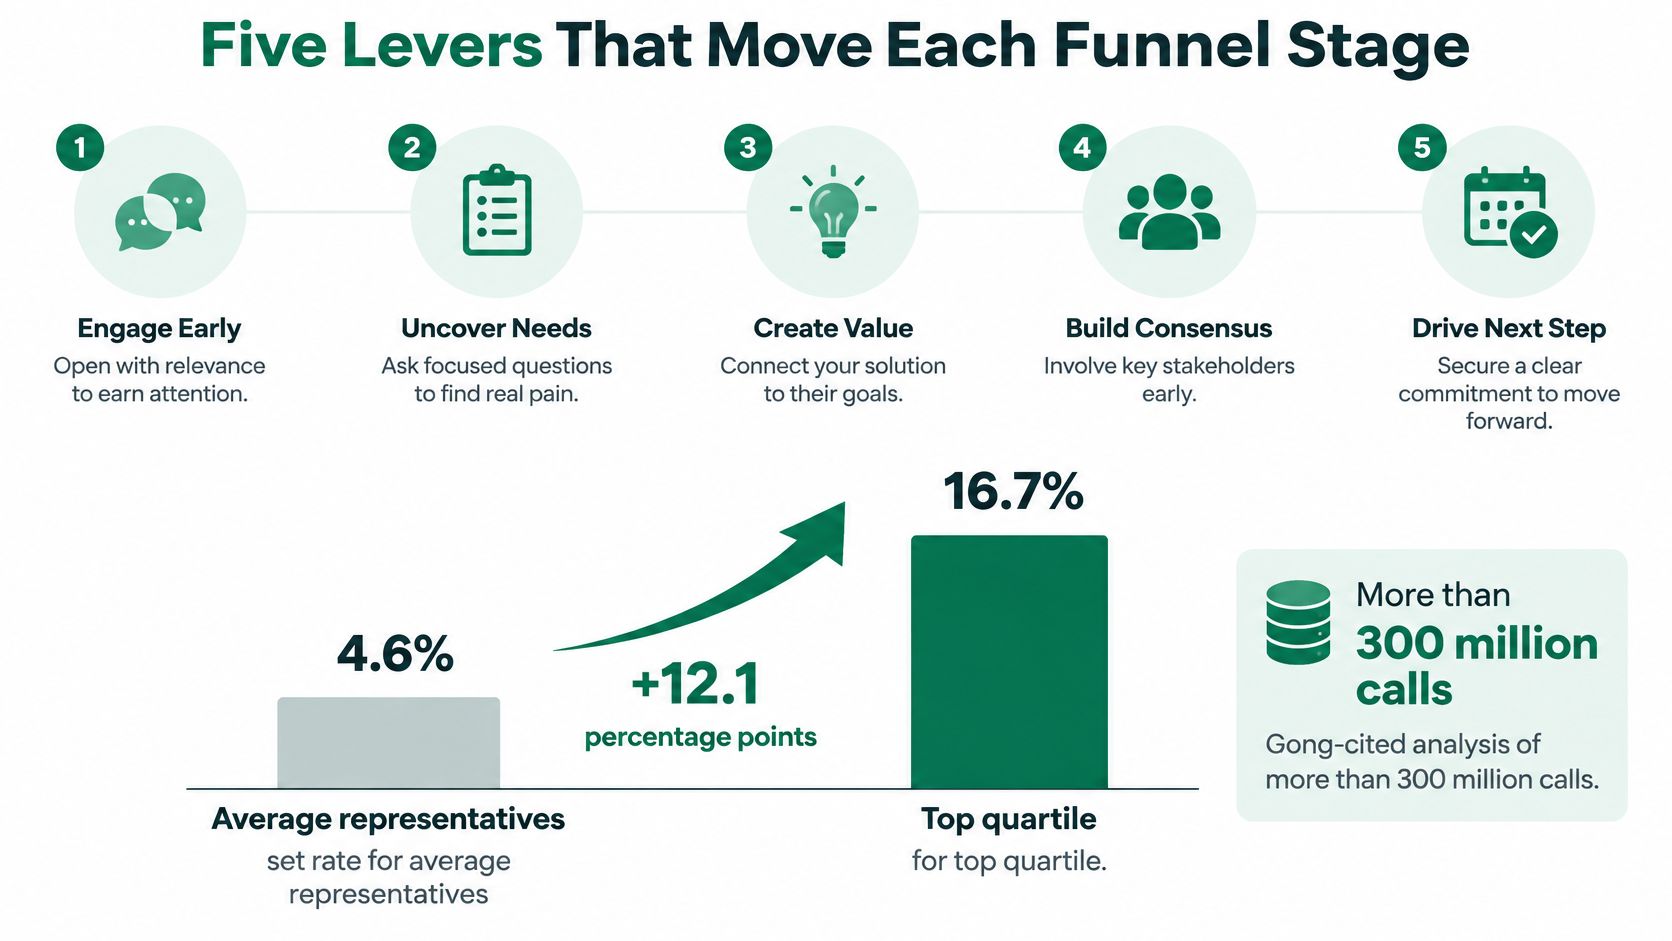
Average and top performers don't live in the same funnel. An analysis cited for more than 300 million calls reported a 4.6% set rate for average representatives versus 16.7% for top quartile representatives, measured after a prospect answered. That gap is approximately 3.6 times.
Skill explains part of it. Inputs explain more than most managers admit. A rep who starts with the right person, a current reason to call, and written qualification criteria isn't fighting the same call as a rep handed a name and a switchboard number.
The comparison below puts that performance gap beside the levers that create it.
Levers Set Before the Dial
1. Contact data moves dial to connect. Call a verified direct line for the likely decision maker, not a generic company number from an old export. In our process, step 2 is identifying the people responsible for buying solutions and gathering their accurate emails, LinkedIn profiles, and phone numbers. That work happens before outreach because bad data makes good calling invisible.
2. Timing moves connect to conversation. Tie the call to a dated business trigger, such as hiring for the target function, new leadership, funding, or a certification deadline. The prospect may still say no, but the call starts from a current business fact instead of a generic pitch. These B2B buying signals for service firms give the rep a reason that can be checked, dated, and quoted back in the opener.
3. Attempt count moves dial to connect over a sequence. One unanswered dial proves almost nothing about reachability. Plan a sequence across different days and times, log each attempt separately, and measure connects by attempt number. If later attempts produce most connects, your first attempt reporting has been understating the list.
Levers Used During the Call
4. The opener moves conversation quality. Build it from the trigger, link it to evidence, and end with one relevant question. Say a consultancy calls an operations lead after a public expansion announcement. The opener names the expansion, asks how the team is handling the added compliance workload, then stops talking. That structure moves the rep from interruption to business context in seconds.
A call ready record should contain more than a phone number. It should name the likely decision maker, show a dated trigger with evidence, and translate that trigger into the first question.
5. Written qualification criteria move conversation to meeting. Decide before the campaign what need, timing, authority, and fit must be present. Reps who improvise qualification book meetings that flatter the rate and disappoint the account executive. Reps who qualify against a short written standard book fewer weak meetings and create cleaner pipeline.
Segment results by rep, trigger type, market, role, verification status, and first attempt versus repeat attempt. Aggregate conversion alone can't tell you whether gains came from better lists or better calling. Rank the five levers by the stage where your numbers are weakest, and improve that stage before you touch the others.
Diagnose the Stage Where Your Calls Stall
Say a team dials 1,000 numbers a month and books 6 meetings. The manager blames the list and orders a new one. Then someone splits the funnel. Connects look healthy, conversations happen at a reasonable pace, but few conversations become meetings. The list wasn't the main leak. Qualification and the meeting ask were.
That's the value of stage diagnosis. It stops you from buying more of the input that already works.
| Symptom | Likely cause | First fix |
|---|---|---|
| Many dials, few connects | Outdated or unverified numbers, or calls at the wrong time of day | Verify direct lines before loading the list and test calling windows by role |
| Connects, but few real conversations | Opener sounds like a pitch, or the call is stopped by a gatekeeper | Open with a dated business trigger and one specific question |
| Conversations, but few meetings | Prospect has no trigger, budget or timing, or qualification comes too late | Qualify on need, timing and authority before asking for the meeting |
| Meetings booked, but not held | No confirmation, or the meeting was booked with someone who has no interest | Send a calendar confirmation and a short pre call note |
| Meetings held, but no opportunities | Wrong decision maker, or no agreed next step | Confirm decision authority early and agree a dated next step before hanging up |
Read Across One Row, Then Test One Fix
Start where the drop is steepest compared with the stage before it. If connects are scarce, don't rewrite the closing script. Check a sample of numbers by hand, confirm the named person still holds the role, and test calling windows by seniority before you replace the whole list.
If conversations stall, listen to the first thirty seconds of recorded calls. A pitch heavy opener gives the prospect nothing to answer except yes or no. Replace it with the trigger and one specific question about how the team is handling that change.
If meetings book but don't hold, tighten the handoff. Send the calendar invitation during the call, add a short note on what you'll cover, and confirm the attendee has a reason to show up. If held meetings create no opportunities, confirm decision authority in the first two minutes and agree a dated next step before anyone hangs up.
Tooling choices matter here, but they don't replace diagnosis. Whether you're weighing an outbound agency against prospecting software, ask how each option reports connects, conversations, meetings, and opportunities separately.
Match your own numbers to one row before you change anything else. One matched row gives you a testable cause. Five simultaneous changes give you a new mystery.
Pick One Funnel Stage to Fix First
Fix the stage that sits furthest below its benchmark and is earliest in the funnel. An early fix feeds every later stage, so a small connect gain creates more conversations, more meetings, and more opportunities without extra dials.
Compare your dial to connect and conversation to meeting rates with the reference points you've already calculated, and check the conversation stage for a preparation or skill gap. If an early stage is furthest off, it wins even when a later stage also looks weak. Later stages can't perform on prospects who never arrive.
Run a Two Week Single Change Test
- Write down the current rate and its denominator. Name the stage in plain language, such as meetings divided by conversations.
- Change one input only. Pick the contact data, the opener, or one qualification question. Don't change all three.
- Run the change on a fixed list. In this worked example, use at least 200 dials over two weeks so one good day can't decide the result.
- Compare qualified meetings per 100 dials. Raw bookings can rise while qualification falls, so judge the final output, not the intermediate win.
- Keep the change only if it lifts that final number. Then repeat the cycle on the next weakest early stage.
The same denominators and steps apply to every rep and every list, in house or outsourced. In our model, agents handle the research, outreach, and follow ups, and the client's team only takes the meetings. That separation only works if both sides judge results by qualified pipeline, not activity. Case study figures on our website reflect results achieved for specific clients in specific contexts and don't guarantee equivalent results for other engagements.
Choose one stage this month, name the single input you'll change, and set the review date now.
If your funnel shows the leak is bad data or poorly timed lists, Trefle.ai delivers call ready B2B opportunities with a named decision maker, a verified direct line, a dated buying signal with proof, and a suggested opener. If you'd rather hand off the calling too, our phone first managed outbound finds those accounts and books qualified meetings for your team. Visit the site, bring your stage numbers, and start with the stage that's broken.